New Relic
Send traces to New Relic
New Relic is a full-stack observability platform for monitoring applications, infrastructure, and digital experiences.
In New Relic, navigate to your API keys:
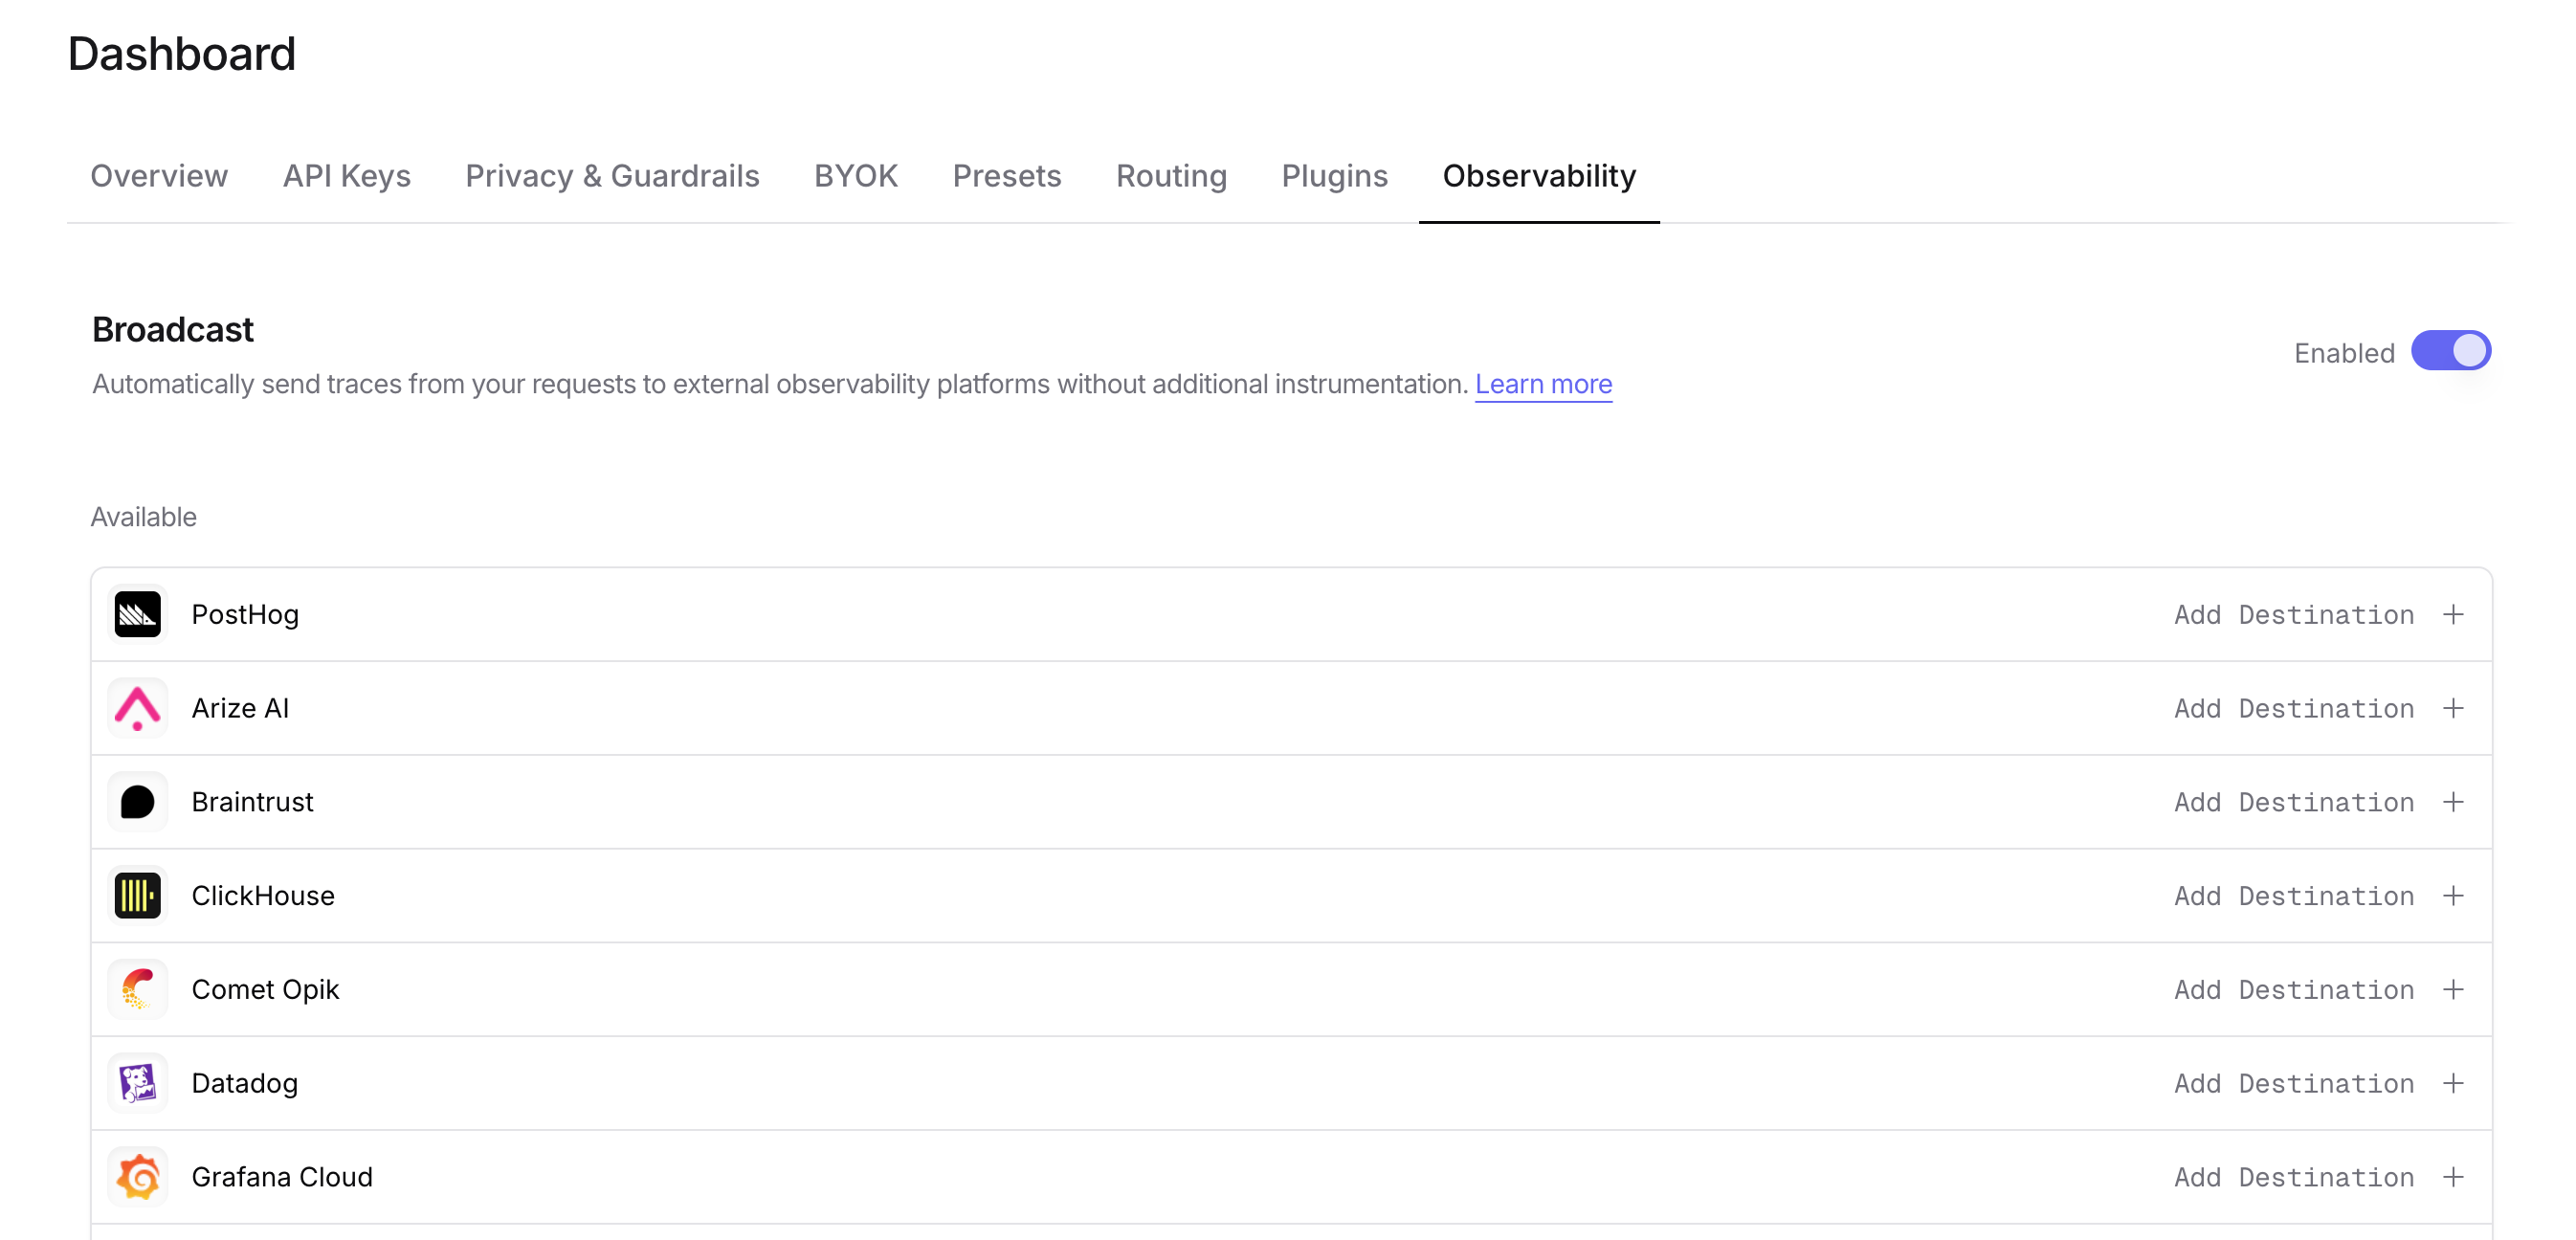
Go to Settings > Observability and toggle Enable Broadcast.
Click the edit icon next to New Relic and enter:
us or eu)Click Test Connection to verify the setup. The configuration only saves if the test passes.
Make an API request through OpenRouter and view the trace in New Relic’s distributed tracing view.
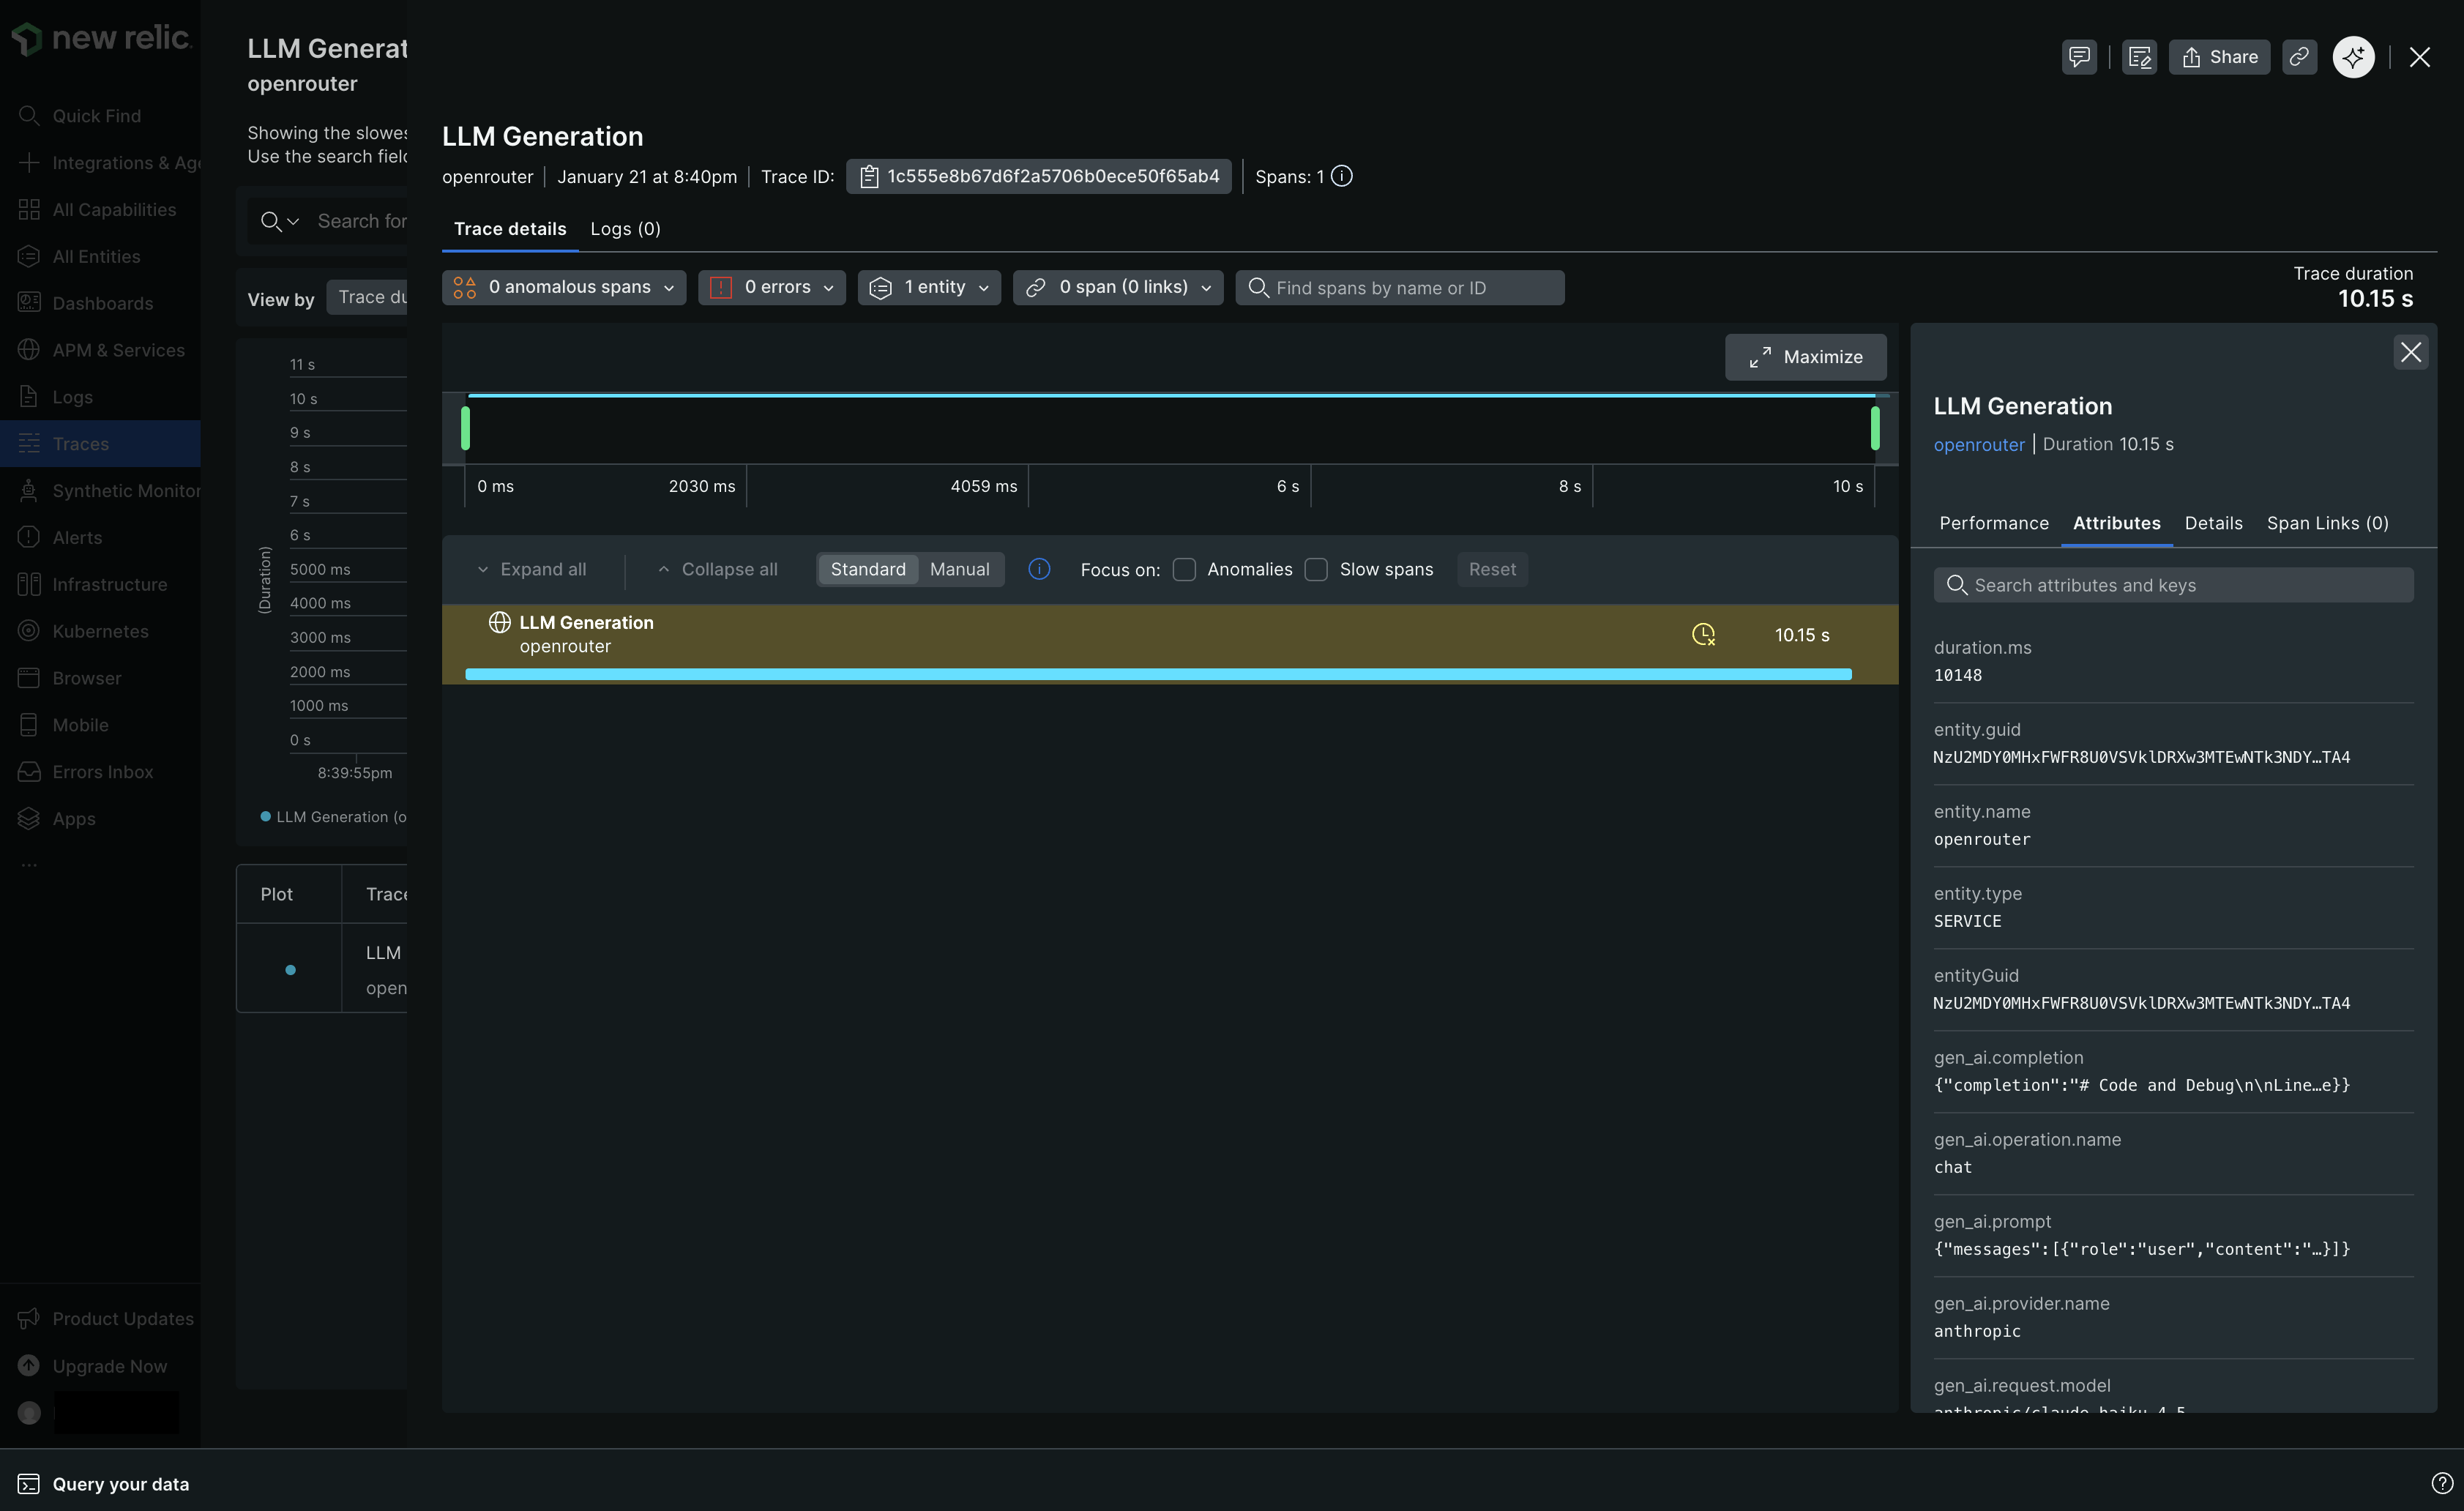
New Relic receives traces via the OTLP protocol. Custom metadata from the trace field is sent as span attributes.
In New Relic’s distributed tracing view, you can:
trace are included as span attributes under the trace.metadata.* namespaceuser field maps to user.id in span attributessession_id field maps to session.id in span attributesgen_ai.* attributes) are used for model, token, and cost dataWhen Privacy Mode is enabled for this destination, prompt and completion content is excluded from traces. All other trace data — token usage, costs, timing, model information, and custom metadata — is still sent normally. See Privacy Mode for details.